System Monitor: 7 Powerful Tools to Boost Performance Instantly
Ever wondered why your server crashes or your app slows down? A solid system monitor could be the hero you didn’t know you needed. It’s not just about tracking CPU usage—it’s about staying ahead of disasters.
What Is a System Monitor and Why It Matters
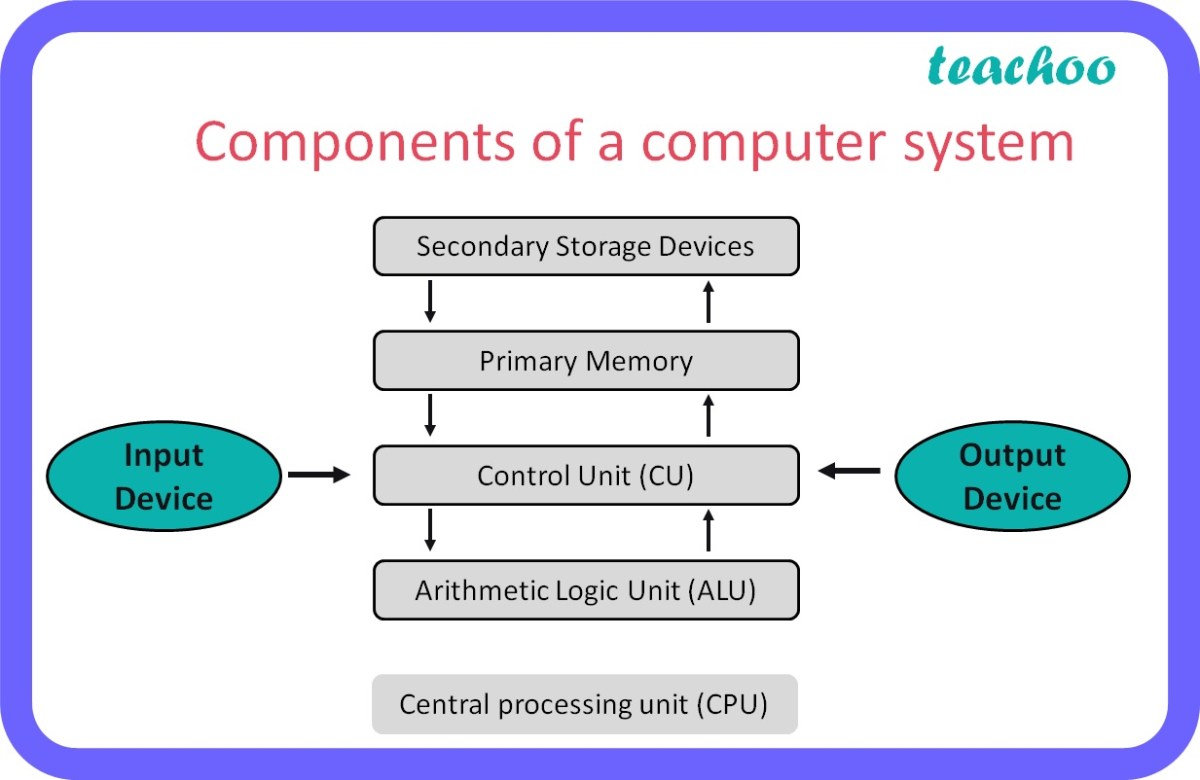
A system monitor is a software tool or hardware device designed to continuously observe and analyze the performance, health, and availability of computer systems, servers, networks, and applications. In today’s digital-first world, where downtime can cost thousands per minute, having a reliable system monitor is no longer optional—it’s essential.
Core Functions of a System Monitor
At its heart, a system monitor performs real-time tracking of key system metrics. These include CPU utilization, memory consumption, disk I/O operations, network bandwidth usage, and process activity. By collecting and analyzing this data, a system monitor helps administrators detect anomalies, prevent outages, and optimize resource allocation.
- Real-time performance tracking
- Alerting on threshold breaches
- Historical data logging for trend analysis
For example, tools like Nagios have long been industry standards for monitoring infrastructure health across thousands of enterprises.
Types of System Monitoring
System monitoring isn’t a one-size-fits-all solution. Different environments require different approaches. Broadly, system monitoring can be categorized into host-based, network-based, application-based, and cloud-based monitoring.
- Host-based monitoring: Focuses on individual machines (servers, workstations).
- Network-based monitoring: Tracks traffic flow, latency, and packet loss.
- Application performance monitoring (APM): Monitors software behavior and response times.
- Cloud monitoring: Observes virtualized resources in AWS, Azure, or Google Cloud.
Each type plays a crucial role in maintaining system integrity. For instance, Prometheus, an open-source system monitor, excels in cloud-native environments with its powerful querying language and flexible alerting.
“Monitoring is not about collecting data—it’s about making data actionable.” — DevOps Engineer, Google Cloud Team
Top 7 System Monitor Tools in 2024
Choosing the right system monitor can make or break your IT operations. With so many options available, it’s vital to understand what each tool offers. Below is a curated list of the top seven system monitor solutions dominating the market in 2024.
1. Nagios XI – The Veteran Powerhouse
Nagios XI remains one of the most trusted names in system monitoring. Known for its robustness and flexibility, it supports both on-premise and hybrid deployments. It provides deep visibility into servers, switches, applications, and services.
- Extensive plugin ecosystem
- Customizable dashboards and reports
- Advanced alerting via email, SMS, or Slack
Nagios integrates seamlessly with existing ITSM tools like ServiceNow and Jira, making it ideal for large organizations. Its active community and extensive documentation further enhance usability.
2. Zabbix – Open Source with Enterprise Muscle
Zabbix stands out as a powerful open-source system monitor that scales from small businesses to global enterprises. It features auto-discovery, web monitoring, and distributed monitoring capabilities.
- Real-time problem detection using machine learning
- Supports SNMP, IPMI, JMX, and custom scripts
- Highly scalable with proxy servers
According to its official site, Zabbix is used by over 100,000 organizations worldwide, including Fortune 500 companies. Its ability to handle millions of metrics per second makes it a top contender.
3. Datadog – Cloud-Native Champion
Datadog has become synonymous with modern cloud monitoring. As a SaaS-based system monitor, it offers full-stack observability across infrastructure, logs, APM, and security.
- Seamless integration with AWS, Kubernetes, and Docker
- AI-powered anomaly detection
- Collaborative dashboards for DevOps teams
Datadog’s strength lies in its unified platform. Instead of juggling multiple tools, teams get everything in one place. Pricing is usage-based, which can be cost-effective for dynamic environments.
4. PRTG Network Monitor – Simplicity Meets Power
Developed by Paessler, PRTG is a Windows-based system monitor that’s intuitive yet feature-rich. It uses sensors to monitor various aspects of your network and systems.
- Over 200 sensor types (e.g., SNMP, Ping, NetFlow)
- Auto-discovery of network devices
- Real-time maps and mobile app support
PRTG is particularly popular among MSPs and small-to-medium businesses. The free version allows up to 100 sensors, making it easy to test before committing.
5. SolarWinds Server & Application Monitor (SAM)
SolarWinds SAM is a comprehensive solution for monitoring both physical and virtual servers, along with critical applications like SQL, Exchange, and SAP.
- Deep application dependency mapping
- Performance optimization recommendations
- Integration with Orion Platform for extended visibility
While SolarWinds faced security scrutiny in 2020, the company has since overhauled its security practices. Today, SAM is trusted by thousands of IT departments for its detailed insights and ease of use.
6. Prometheus + Grafana – The Open-Source Dream Team
Prometheus, paired with Grafana, forms one of the most powerful open-source system monitor stacks. Prometheus collects and stores time-series data, while Grafana visualizes it beautifully.
- Pull-based model with HTTP endpoints
- Flexible query language (PromQL)
- Excellent for Kubernetes and microservices
This combo is favored by DevOps engineers for its scalability and transparency. The Grafana dashboard allows users to create stunning, interactive visualizations that make complex data easy to understand.
7. New Relic – Full-Stack Observability Leader
New Relic offers a modern approach to system monitoring with its all-in-one observability platform. It tracks everything from infrastructure metrics to user behavior in web applications.
- Real-time code-level diagnostics
- Distributed tracing for microservices
- Free tier with generous limits
New Relic’s AI-driven insights help teams identify bottlenecks before they impact users. Its browser monitoring feature gives unparalleled visibility into frontend performance.
Key Metrics Tracked by a System Monitor
A good system monitor doesn’t just collect data—it collects the *right* data. Understanding which metrics matter most can help you fine-tune your monitoring strategy and avoid information overload.
CPU Usage and Load Average
CPU utilization is one of the most fundamental metrics tracked by any system monitor. High CPU usage over extended periods can indicate inefficient code, runaway processes, or insufficient hardware.
- Normal range: 30–70% under load
- Load average (1, 5, 15 min) shows system demand over time
- Sustained load above number of CPU cores signals congestion
Tools like htop and top in Linux provide real-time CPU views, while system monitor platforms like Zabbix aggregate this data over time for trend analysis.
Memory Utilization and Swap Activity
Memory (RAM) is a finite resource. When applications consume too much, the system starts using swap space on disk, which drastically slows performance.
- Monitor free vs. used memory, including cache/buffers
- Watch for excessive swap usage (a red flag)
- Identify memory leaks in long-running processes
A system monitor should alert when memory usage exceeds a threshold (e.g., 85%) and help pinpoint which process is consuming the most RAM.
Disk I/O and Latency
Disk performance is often the bottleneck in database-heavy applications. A system monitor tracks read/write operations per second (IOPS), throughput, and latency.
- High latency (>10ms) indicates storage issues
- Sudden spikes in I/O may point to backup jobs or malware
- Monitor disk queue length and utilization %
For example, in AWS, CloudWatch (a built-in system monitor) can track EBS volume performance and trigger alarms when latency exceeds acceptable levels.
Network Throughput and Packet Loss
Network health is critical for distributed systems. A system monitor checks bandwidth usage, error rates, and connectivity status.
- Monitor inbound/outbound traffic per interface
- Detect packet loss or retransmissions
- Use NetFlow/sFlow for traffic analysis
Tools like Wireshark complement system monitors by providing packet-level detail during troubleshooting.
“You can’t manage what you can’t measure.” — Peter Drucker
How to Choose the Right System Monitor for Your Needs
Selecting a system monitor isn’t just about features—it’s about fit. The best tool for a startup might overwhelm a small business, while an enterprise-grade solution might be overkill for a personal project.
Assess Your Environment Size and Complexity
Start by evaluating the scale of your infrastructure. Are you managing a single server, a small office network, or a multi-cloud environment?
- Small setups: PRTG, Nagios Core, or Datadog’s free tier
- Mid-sized: Zabbix, SolarWinds SAM
- Large/enterprise: Datadog, New Relic, Splunk
Complexity also matters. Microservices architectures demand tools like Prometheus or New Relic that support distributed tracing and container monitoring.
Consider Deployment Model: On-Premise vs. Cloud
Your deployment preference affects your choice. On-premise solutions offer more control and data privacy but require maintenance.
- On-premise: Nagios, Zabbix, PRTG
- Cloud/SaaS: Datadog, New Relic, LogicMonitor
- Hybrid: Most modern tools support both
Cloud-based system monitors are easier to scale and update, making them ideal for fast-growing companies. However, they may incur higher long-term costs and depend on internet connectivity.
Evaluate Integration and Extensibility
A system monitor should work with your existing tools. Check for integrations with:
- Configuration management (Ansible, Puppet)
- CI/CD pipelines (Jenkins, GitHub Actions)
- Incident management (PagerDuty, Opsgenie)
- Cloud platforms (AWS, Azure, GCP)
For example, Datadog offers over 500 integrations, making it one of the most extensible system monitor platforms available.
Best Practices for Effective System Monitoring
Even the best system monitor won’t help if used poorly. To get the most value, follow these proven best practices that top DevOps teams swear by.
Set Meaningful Thresholds and Alerts
Alert fatigue is real. Too many notifications lead to ignored warnings. Set thresholds based on historical data and business impact.
- Use dynamic baselines instead of static values
- Escalate alerts based on severity (e.g., warning vs. critical)
- Suppress non-actionable alerts during maintenance windows
For instance, a CPU spike during a nightly backup might be normal—your system monitor should know that and avoid triggering false alarms.
Use Dashboards to Gain Operational Visibility
Dashboards turn raw data into actionable insights. A well-designed dashboard shows the health of your entire system at a glance.
- Include KPIs like uptime, response time, error rate
- Group related metrics (e.g., all database servers)
- Enable role-based views (e.g., dev vs. ops)
Grafana excels here, allowing teams to build custom dashboards that update in real time. Many companies display these on wall-mounted screens for instant awareness.
Implement Proactive Monitoring and Trend Analysis
Don’t wait for failures. Use your system monitor to predict issues before they happen.
- Analyze trends in disk usage to forecast capacity needs
- Monitor application response times for gradual degradation
- Use machine learning features (e.g., Datadog’s Anomaly Detection)
Proactive monitoring can prevent outages and extend hardware lifespan by identifying underperforming components early.
Common Challenges in System Monitoring and How to Overcome Them
Even with the best tools, system monitoring comes with hurdles. Recognizing these challenges is the first step to overcoming them.
Data Overload and Noise
Modern systems generate terabytes of monitoring data daily. Without proper filtering, this leads to noise and missed signals.
- Solution: Use log aggregation tools like Elasticsearch or Splunk
- Apply tagging and filtering to focus on relevant data
- Leverage AI to detect patterns and anomalies
For example, combining a system monitor like Zabbix with the ELK Stack (Elasticsearch, Logstash, Kibana) can provide both infrastructure and log-level insights in one ecosystem.
Tool Sprawl and Fragmentation
Many organizations end up with multiple monitoring tools—each for servers, networks, apps, and databases. This fragmentation makes troubleshooting harder.
- Solution: Consolidate to a unified observability platform (e.g., Datadog)
- Use APIs to integrate disparate tools
- Adopt open standards like OpenTelemetry
OpenTelemetry, supported by the Cloud Native Computing Foundation, is emerging as a universal standard for telemetry data, helping reduce vendor lock-in.
Security and Compliance Risks
Monitoring tools have deep access to systems, making them attractive targets for attackers. Poorly secured monitoring setups can become backdoors.
- Solution: Enforce role-based access control (RBAC)
- Encrypt data in transit and at rest
- Audit access logs regularly
After the SolarWinds breach, many organizations now require third-party security audits before deploying any system monitor in production.
The Future of System Monitoring: AI, Automation, and Beyond
The world of system monitoring is evolving rapidly. As infrastructure becomes more complex, monitoring tools must keep pace with smarter, faster, and more autonomous capabilities.
AI-Driven Anomaly Detection
Traditional threshold-based alerts are giving way to AI-powered anomaly detection. These systems learn normal behavior and flag deviations—without manual configuration.
- Detects subtle issues before they escalate
- Reduces false positives by understanding context
- Used by Datadog, New Relic, and Dynatrace
For example, Google’s SRE teams use AI models to predict outages based on historical incident patterns and real-time telemetry.
Automated Remediation and Self-Healing Systems
The next frontier is not just detecting problems—but fixing them automatically. Modern system monitors are integrating with automation tools to enable self-healing infrastructure.
- Restart failed services automatically
- Scale resources up/down based on load
- Roll back faulty deployments using CI/CD hooks
Tools like Ansible and Terraform can be triggered by alerts from a system monitor, creating a closed-loop remediation process.
Observability Over Monitoring
The industry is shifting from traditional monitoring to full observability. While monitoring asks “Is the system up?”, observability asks “Why is it behaving this way?”
- Combines metrics, logs, and traces
- Enables deep root cause analysis
- Empowers developers and SREs alike
As microservices and serverless architectures grow, observability becomes critical. Platforms like Honeycomb and Lightstep are leading this shift, offering deep insights into complex distributed systems.
What is a system monitor?
A system monitor is a tool that tracks the performance, availability, and health of computer systems, networks, and applications in real time. It helps detect issues, prevent downtime, and optimize resource usage.
Which system monitor is best for small businesses?
For small businesses, PRTG Network Monitor and Nagios Core are excellent choices due to their ease of use, affordability, and strong feature sets. Both offer free versions to get started.
Can a system monitor prevent server crashes?
While a system monitor can’t prevent crashes directly, it can alert administrators to warning signs—like high CPU, memory exhaustion, or disk failure—allowing them to take corrective action before a crash occurs.
Is cloud-based system monitoring secure?
Yes, most reputable cloud-based system monitors use encryption, access controls, and compliance certifications (like SOC 2, GDPR) to protect data. However, organizations should review security policies and conduct audits before deployment.
How does AI improve system monitoring?
AI enhances system monitoring by detecting anomalies, predicting failures, and reducing false alerts. It learns normal behavior patterns and identifies deviations that might go unnoticed with rule-based systems.
In today’s hyper-connected world, a reliable system monitor is no longer a luxury—it’s a necessity. From preventing costly outages to optimizing performance, the right monitoring strategy can transform your IT operations. Whether you’re a small business or a global enterprise, the key is to choose a tool that fits your environment, set smart alerts, and embrace the shift toward observability. As technology evolves, so too must our approach to monitoring—leveraging AI, automation, and unified platforms to build resilient, self-healing systems. The future of system monitoring isn’t just about watching—it’s about understanding, predicting, and acting.
Further Reading:
